Crypto trading involves a lot of technical analysis, and one of the fundamental concepts in this field is the support and resistance levels. Understanding support and resistance is crucial to successful trading, as it helps traders identify potential buying and selling points.
In this blog post, we will discuss the basics of support and resistance in crypto trading.
What are Support and Resistance?
What is Support?
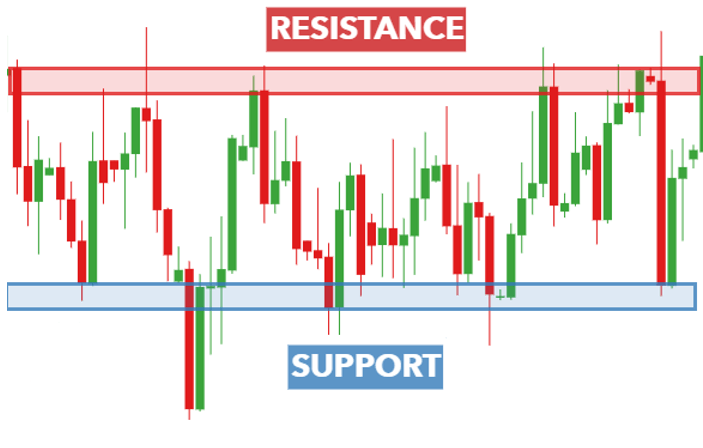
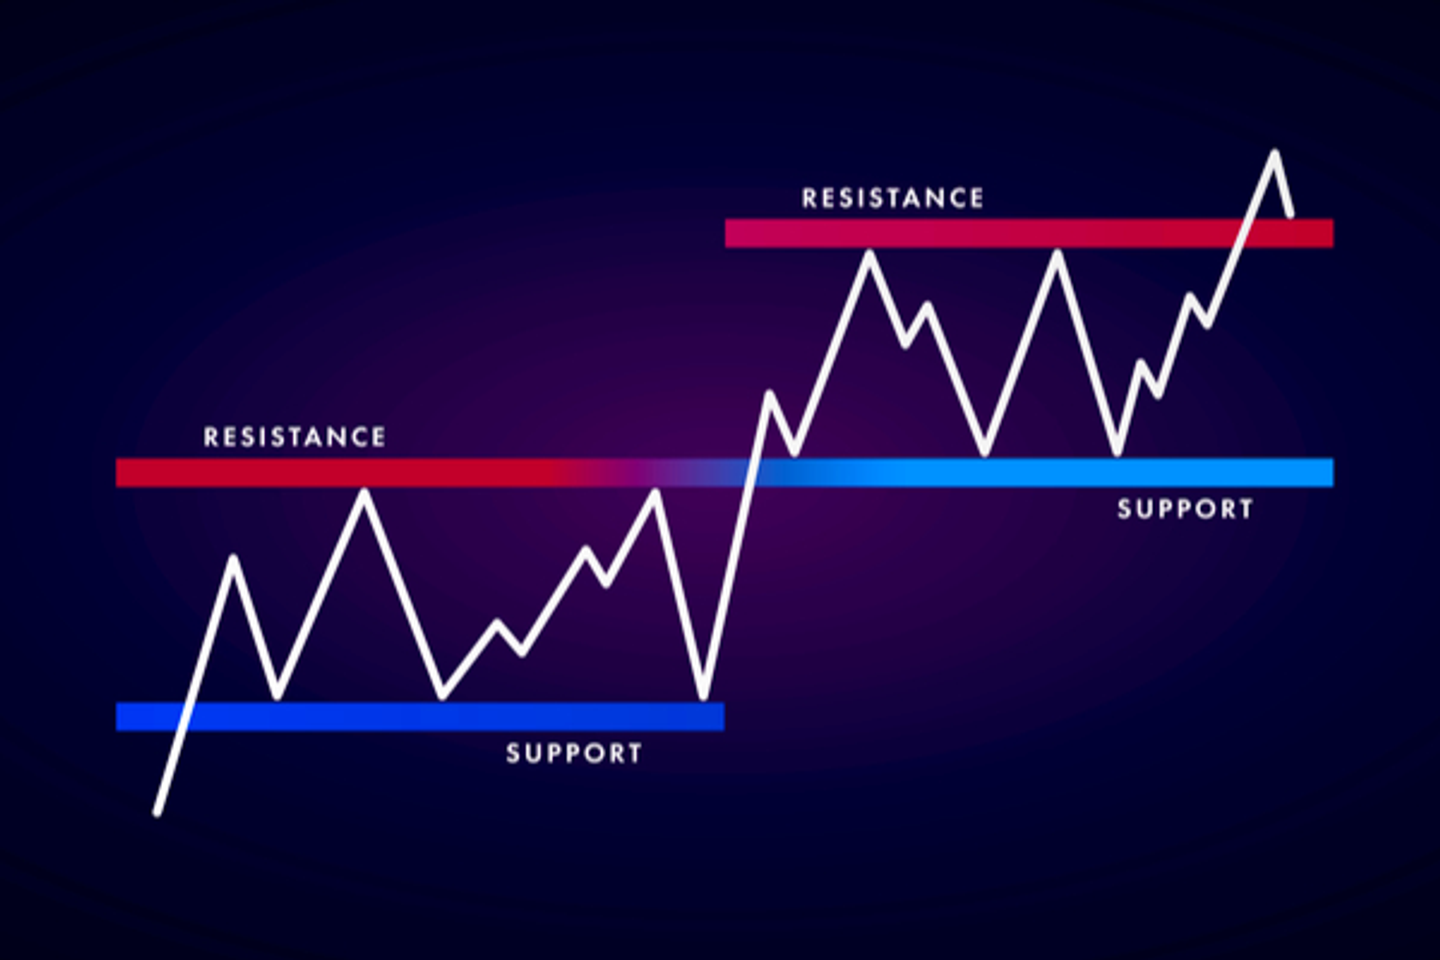
In trading, support refers to a price level that an asset has difficulty falling below. This level is usually determined by the demand for the asset, as traders are willing to buy the asset at this level to prevent it from falling further. When an asset reaches a support level, traders are more likely to buy, which can cause the asset's price to increase.
What is Resistance?
On the other hand, resistance refers to a price level that an asset has difficulty exceeding. This level is determined by the supply of the asset, as traders are more willing to sell the asset at this level to prevent it from rising further. When an asset reaches a resistance level, traders are more likely to sell, which can cause the asset's price to decrease.

How to Identify Support and Resistance Levels?
Identifying support and resistance levels requires some technical analysis. One common method is to look at historical price charts and identify areas where the price has reversed direction in the past. These areas are likely to act as support or resistance levels in the future.
Here's a step-by-step guide on how to find support and resistance levels in CoinScreener:

Step 1: Open CoinScreener and choose a market
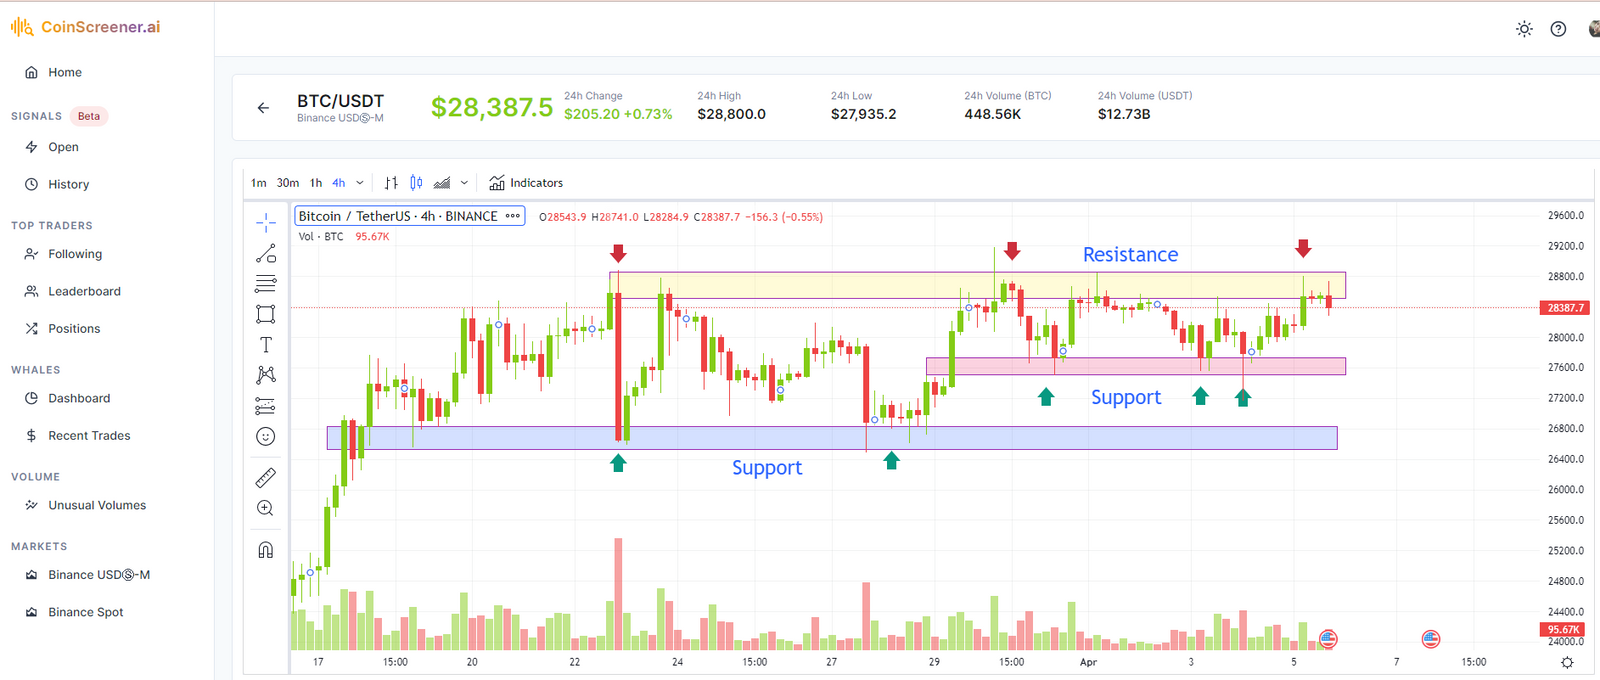
The first step is to open CoinSreener and choose a market that you want to analyze. Here we choose the BTC/USD chart for example as above.
Step 2: Select a timeframe
Once you have chosen your market, select a timeframe that suits your trading style. CoinScreener offers a range of timeframes, from one-minute charts to monthly charts. Generally, shorter timeframes are used for short-term trading, while longer timeframes are used for long-term trading.
Above you can see there is a short-term 1-hour timeframe and a long-term 4 hours timeframe.
Step 3: Identify support and resistance levels
Look at historical price charts and identify areas where the price has reversed direction in the past. These areas will likely act as support or resistance levels in the future. You can also use the volume history chart to identify the last support/resistance zone.
For example, on March 23rd and March 28th, there was high volume and price volatility, which made it challenging for the price to fall below the support zone, which is indicated by the blue line on the chart. Similarly, we can find the short-term support zone for the 1-hour timeframe in the red line.
On the other hand, the resistance zone is identified by the yellow line. In this case, we can see that the price had difficulty exceeding the $28,600 area, indicating that this is a significant resistance level.
Step 4: Take action
Finally, adjust your strategy based on the support and resistance levels you have identified. Here you can take advantage of CoinScreener's unusual volume alert feature. When a pump/dump unusual volume signal is generated, you can use the support/resistance zones you've identified to help make informed trading decisions.
For example, if an alert shows that a cryptocurrency is experiencing a significant increase in volume and is approaching a resistance level, you may want to consider placing a short order to take profits. Conversely, if the alert shows that the cryptocurrency is approaching a support level, you may want to consider placing a long order to capitalize on the potential for an upward price movement.
Related: Uncover Hidden Trading Opportunities with CoinScreener's Unusual Activity Alerts
Another method is to use technical indicators such as moving averages, trend lines, and Fibonacci retracements. Moving averages are used to identify trends and can act as support or resistance levels. Trend lines are drawn to connect the high and low points of an asset's price, and they can also act as support or resistance levels. Fibonacci retracements are used to identify potential levels of support and resistance based on the asset's price movements.
Why Are Support and Resistance Levels Important?
Support and resistance levels are important because they provide traders with potential entry and exit points. Traders can use support levels to identify potential buying opportunities and resistance levels to identify potential selling opportunities. By identifying these levels, traders can set stop-loss orders to minimize their losses if the asset's price moves against their position.
Conclusion
In conclusion, support and resistance levels are fundamental concepts in crypto trading. Understanding these levels is crucial to successful trading, as it helps traders identify potential buying and selling points. By using technical analysis and identifying historical price movements, traders can identify support and resistance levels and use them to make informed trading decisions.
If you aspire to become a pro-crypto trader, then you have clicked at the right place. Coinscreener is a trading tool platform that provides crypto traders, especially crypto newbies to screen trading signals on markets, follow, and analyze the trading behavior of Whales, Top Traders to identify the best market trends and make the most profits out of their trades.
Follow CoinScreener: https://linktr.ee/coinscreener.ai
KEY FEATURES:
📈 1. Trading Signals:
Maximize your trading opportunities with signals produced through advanced technical analysis & AI algorithms.
📊 2. Top Trader Alerts:
Follow top traders and get notified when they open, close, or adjust their positions.
🐳 3. Whale Alerts:
Get alerted of large buys/sells and track the history of whale activities for 1000+ Future & Spot markets.
🙈 4. Unusual Activity Alerts
Get real-time alerts on market pumps & dumps and unusual volume activities.
#coinscreener #coin #screener #coinscreener.ai #crypto #ai #cryptosignals #cryptocoin #token #cryptoscreener #screenerapp #screenertool #tradingsignals #aitradingsignals #technicalanalysisscreener #technicalanalysis #tradingbot #cryptohopper #cryptobot #dcabot #robot #calculatorcrypto #btc #binance #liquidations #fundingrate #cryptoscreener #btcliquidation #cryptoliquidation #Liquidation #future #futuretrading #cryptocalculator


